Anyone can put a number in a report Here’s what’s behind ours
Anyone can put a number in a report. A clean chart, a popping percentage, an arrow pointing up and to the right. The steeper the better. From the outside there’s no real way to tell whether it means anything, or whether someone just liked how it looked on the page. And I built the measurement behind most numbers in Forward·Inc’s impact report, so I’m the last person whose word you should take.
So, over the next five posts, I want to take you into the engine room of how these numbers come to be, where they’re solid and where they aren’t. I’ll open it up, show you the moving parts, and point at the ones that still rattle. I’ll do that by using the metrics shown in the report. For today, one that hopefully speaks to the imagination: “Understanding of Local Business Culture”.
Here it is. That understanding climbed from 4.16 to 5.09. A 22.3% increase. Wonderful. And also, on its own, almost useless. Is 22.3% a lot? Compared to what? Above what we hoped for? Below expectations? The number can’t say. It just sits on the page looking confident. And you can’t answer any of these questions from the figure alone, which is the problem with stats in most reports.
So it needs explaining, beginning with what it measures. Business culture is local and mostly unwritten (Ardichvilli et al., 2010), the assumed stuff like how direct you’re expected to be, what counts as professional, and which forms the Chamber of Commerce and tax office expects you to have read before you opened your doors. For someone who arrived recently, that gap is wide, perhaps even costly, and the further their home business culture sits from this one, the harder it is to operate (Chevrier et al. 2023). As an organisation supporting entrepreneurs facing this challenge, that makes it worth measuring. But how?
Measuring change, not memory
One way to get this number would be to wait until a program ends and ask people to rate, out of ten, how much we improved their understanding. We don’t, for two reasons. First, it asks people to be their own historian. If people are as forgetful as I am, we’d be measuring a complete and total guess about change, not change itself. Second, “how much did we help you” isn’t really a question about business culture. It’s a question about us, and someone who just finished a program they enjoyed tends to answer warmly.
So we don’t ask people to estimate the change. We measure it. The same people answer the exact same questions at the start of a program and again at the end, and the gap between the two is the result.
The stolen questions
The next moving part is the questions, and, I must confess, I steal those questions. The culture items come from a published, peer-reviewed instrument, the Business Cultural Intelligence Quotient (Ang et al. 2016, adapted). That matters because it takes the wording out of our hands. We can’t quietly rephrase a question until it gives the answer we’d like. The items were fixed by academics with no stake in how Forward·Inc looks. These researchers check whether the statements hang together as one thing, whether people read each one the way it was meant, whether it behaves consistently across different groups, and whether it captures what it claims. The strongest instruments are also tested against real outcomes, to see whether the score predicts what it should. None of this makes a scale perfect, but it is a long way from a question that I come up with myself.
Each person against their past self
There’s one more choice hidden in that before-and-after comparison. You can compare the average of everyone’s before-scores with the average of everyone’s after-scores. We don’t. We compare each person to their own earlier answer and average the individual changes instead. Two things make that fairer. A 5 from a modest self-rater and a 5 from a confident one (men, we see you) aren’t the same 5, so averaging across different people partly averages their personalities. Compare someone to themselves and that trait cancels out.
There’s a quieter problem too. People who drift away from a program tend not to fill in the final survey, so a plain group comparison weighs everyone at the start against only the ones who stayed, and the after-figure climbs for reasons that have nothing to do with us.
To be clear, comparing groups isn’t wrong! It’s how randomised trials work. But it leans on large numbers or random assignment to stay honest, and a single cohort gives us neither. So we compare each person to their own past self, which is simply the fairer measure here.
Beyond averages
But even an honest average is still an average, one number trying to say something about hundreds of people. A 22.3% rise could mean everyone nudged up a little, or that most barely moved while a few shot up. Those are very different results, and that single percentage can’t tell them apart. So we don’t just report the average. We report the whole distribution.
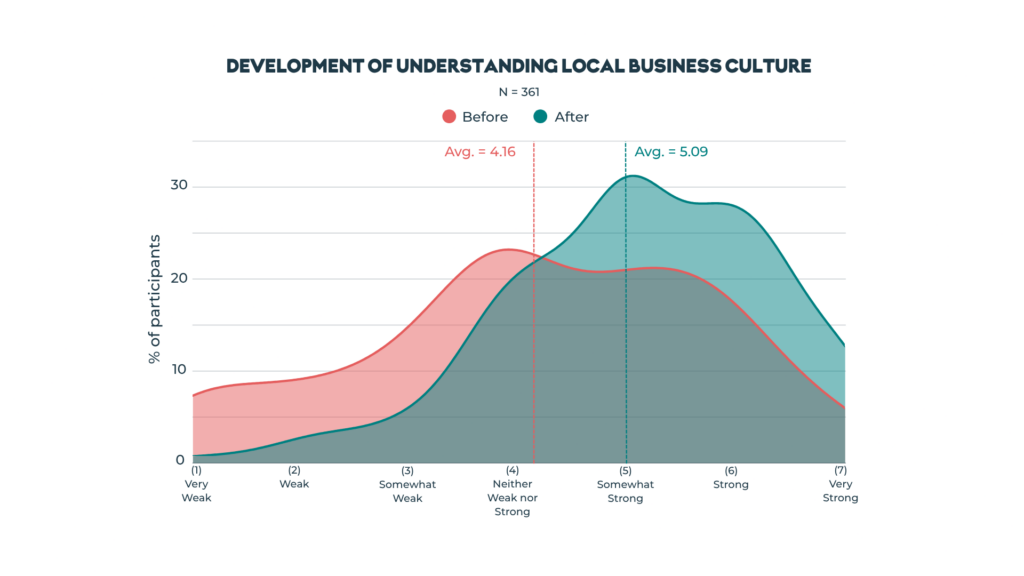
That picture is an overlapping kernel density estimate, a phrase that mostly exists to make me sound clever. In plainer terms it’s a smoothed bar chart, a curve showing how the answers spread across the scale, with the before laid over the after. And the shape says more than the number did.
Before the program, around 7.5% of people sat at the very bottom, rating their understanding of their local business culture as very weak. Afterwards, almost nobody is down there. Higher up, the share of people calling their understanding of local business culture “somewhat strong” grew from a little over 20% to more than 30%.
What it can’t tell you
There’s a limit though, sitting underneath all of it. And it’s the same limit that is present under many numbers in the report. Many statistics are based on self-reported data. People rated their own understanding, and nobody from outside checked it. We don’t have data from the Dutch supplier, the investor, or the customer on the other side of those interactions, the people who’d actually know whether the understanding landed. So what we’re capturing is partly understanding and partly confidence about it, and we can’t fully separate the two.
Confidence isn’t nothing, to be fair. Daring to walk into a meeting and hold your own is part of what cultural fluency even is (Chevrier et al., 2023). But it’s still a real limit, and I’d rather name it than write around it. A score can climb because someone understands more, or because they feel they do.
It will never be perfect. At the end of the day, this is a social science, not a natural science, and pretending otherwise would be the least scientific thing we could do.
That’s one number, opened up and held to the light.
Although I must confess, there’s another limitation that I have quietly stepped around. Even a fair, well-measured before-and-after can’t tell you we caused the change. A Forward·Inc program is not the only thing participants have going on in their life, and some of that movement would have happened with or without us. Sorting the program’s effect from everything else is the hardest problem in this work, and it’s the one the next post takes on.
And for those of you who are curious about the whole report, you can find it here!
Ang, S., Van Dyne, L., Koh, C., Ng, K. Y., Templer, K. J., Tay, C., & Chandrasekar, N. A. (2007). Cultural intelligence: Its measurement and effects on cultural judgment and decision making, cultural adaptation and task performance. Management and Organization Review, 3(3), 335–371.
Ardichvili, A., Jondle, D., & Kowske, B. (2010). Dimensions of ethical business cultures: comparing data from 13 countries of Europe, Asia, and the Americas. Human Resource Development International, 13(3), 299-315.
Chevrier, S., Goiseau, E., Lugosi, P., & Rase, J. F. (2023). Managing mentoring for the labor market integration of humanitarian migrants. Journal of International Management, 29(6), 101062.